
Slow server, remote access choking… a simple ls takes seconds to run. Open a log file? Forget it. You have time to brew coffee, drink the coffee, and the cursor is still there, blinking, mocking your face.
You rush to the server panel (or the rack, if you’re old school) and see the hard drive LED stuck on, looking like the Power light, but red and desperate. Or, if you’re in the cloud, you see the CPU IO Wait graph hitting the ceiling.
And you think: “This is bad. What’s killing my disk?”
Back in the day, we had to guess. Today, we use iotop.
The Problem: Who’s eating the disk?
In heavy I/O situations, the million dollar question is: which process is doing this?
Tools like iostat or vmstat (the bi and bo columns) show you that the disk is being hammered, but they don’t tell you who the culprit is. They give you the symptom, not the perp’s name.
That’s where iotop comes in. It’s like top, but for disk. It shows in real-time which process is reading or writing, how much it’s consuming, and gives you the PID so you can take appropriate action (read: kill -9 or optimize the application).
Installation (no kernel compiling, please)
If you found some old 2009 article telling you to compile the kernel and install Python by hand… forget it. Life in 2026 is easier.
Nowadays, TaskStats support comes enabled in the kernel of any decent distribution. You just need to install the package.
Debian / Ubuntu / Mint
sudo apt update
sudo apt install iotop
RHEL / CentOS / Fedora / AlmaLinux
sudo dnf install iotop
Arch Linux
sudo pacman -S iotop
Some modern distros already ship
iotop-c, which is a version rewritten in C, much lighter than the original Python one. If your package manager has this option, prefer it!
How to use (no secrets here)
The command needs root because it reads kernel structures that regular users can’t touch.
sudo iotop
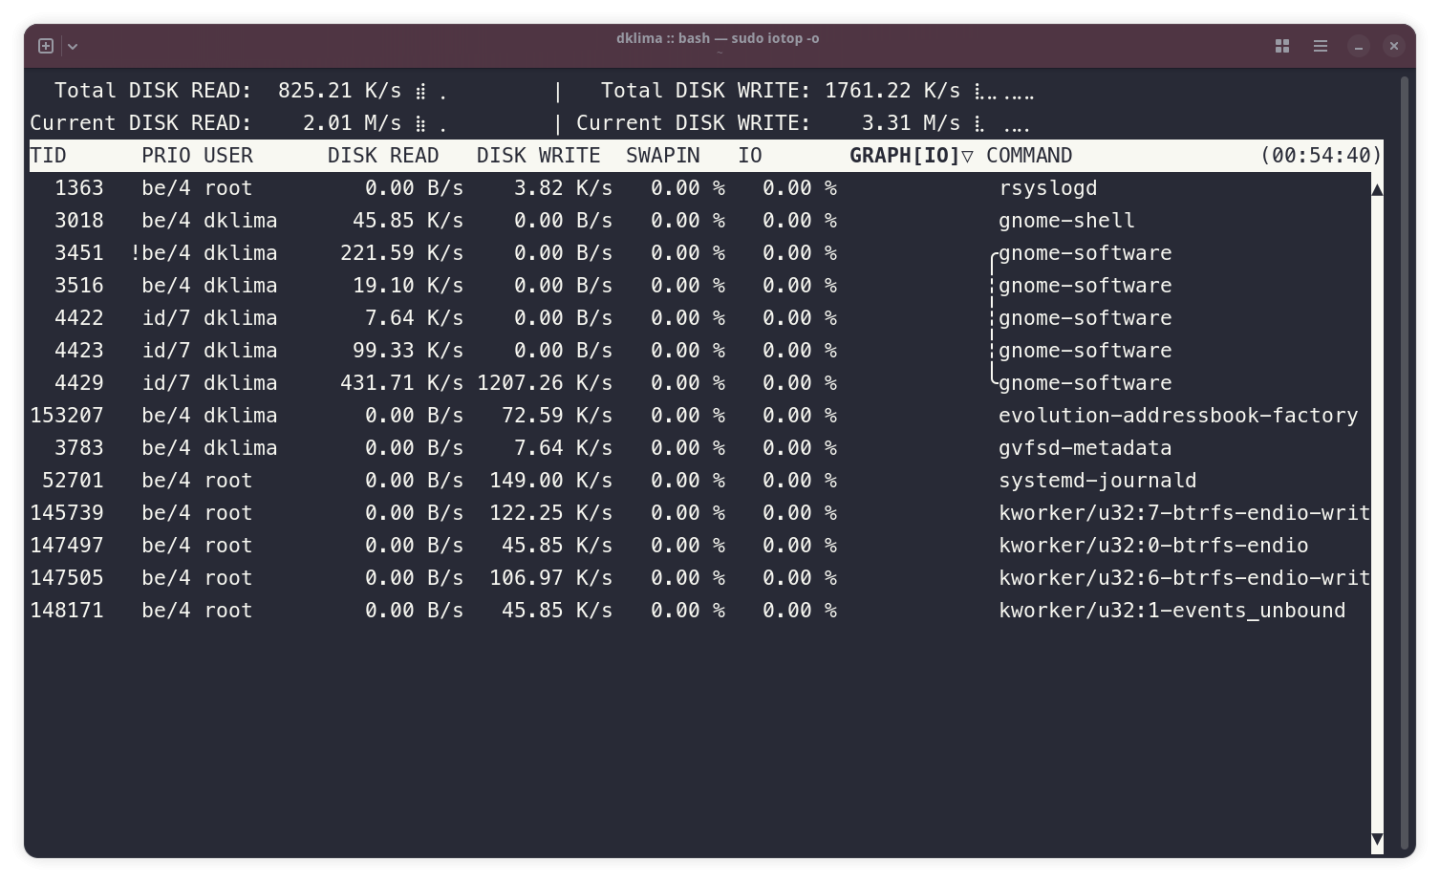
But plain iotop shows all processes, including those doing nothing with the disk. This clutters the screen. The pro move is using the -o flag (only), which shows only what’s generating disk traffic right now:
sudo iotop -o
Other useful flags
-o(Only): Shows only what’s using disk. Essential.-P(Processes): By default,iotopshows threads. If you have Java or MariaDB running, you’ll see hundreds of lines. Use-Pto group everything and see only the main processes.-a(Accumulated): This one’s magic. Instead of showing instantaneous speed, it shows the accumulated read/write since you opened the program. Great for catching that script that runs quickly, disappears, and comes back every 5 seconds.
Understanding what you see
“Where are the SWAPIN and IO columns?”
If you opened iotop and only saw the read and write columns, without SWAPIN and IO… relax. You’ll probably see a warning like this:
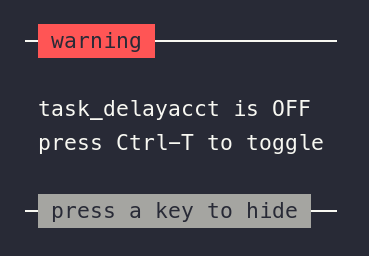
This happens because the kernel has a feature called task_delayacct that needs to be active to collect these delay metrics. It’s what allows the kernel to track how long each process spends waiting for I/O.
The good news? You can enable it on the fly, no restart needed. Just press Ctrl+T inside iotop and it toggles it for you. Done, the magic columns appear.
Because collecting these metrics has a cost (small, but it exists). Some distros prefer to leave it off by default and you enable it when needed. Makes sense.
The main columns
Now, with everything enabled, you’ll see four columns that matter:
DISK READ and DISK WRITE are the obvious ones — they show read and write speed in bytes per second. That backup running? It’ll show up with about 200 MB/s of WRITE. Easy to understand.
SWAPIN and IO are percentages of wait time. And this is where the real diagnosis lives:
- SWAPIN high? Your problem isn’t disk, it’s RAM. The process is waiting for memory to come back from swap.
- IO high? Bingo. The process is stuck waiting for the disk to respond.
If you see a process with IO near 99%, you found the culprit. It’s monopolizing the disk and freezing everything else.
“But DK, I use NVMe SSD, does this still matter?”
It matters even more.
Yes, SSDs are fast. But in the cloud (AWS, Azure, DigitalOcean), disks have IOPS limits (operations per second). If you exceed that limit, the cloud “throttles” your performance. The disk becomes artificially slow.
iotop helps you see if you’re hitting that ceiling. Sometimes, a misconfigured error log writing 1GB of useless text per minute is enough to freeze a small instance, even with SSD.
The Bottom Line
Don’t go resetting slow servers like a desperate person. Install iotop, run sudo iotop -oP, find the culprit process, and fix the problem at its root.
Your server will thank you, and so will your coffee (because now you’ll drink it calmly, not stressed out).


Comentários
Comentários fechados para visitantes. Entre ou registre-se para comentar.